HOME


Below are the results from scalability tests of the open source Pregel framework GoldenOrb (Golden Orb), along with a side by side comparison of scalability results for Google's Pregel framework and the Apache project for large scale graph processing, Giraph (which, like GoldenOrb, also provides an open source implementation of the Pregel framework / Pregel API).

The results presented here for GoldenOrb were generated using the latest code base available as of March 2012.


Methodology

See this paper for background on and an example of scalability testing. Additional information can be found here and here.

GoldenOrb (Golden Orb) scalability testing was done using the Amazon Elastic Compute Cloud (Amazon EC2) with 1, 2, 3, 4, 8 and 9 large instance clusters. Each test used a single master instance and multiple slave instances (except for the single node runs which had only a master instance). Larger cluster sizes were not used due to issues with the stability of GoldenOrb when dealing with extremely large graphs: see results for "MAX CAPACITY" presented below.

Data points for the Pregel framework were gathered from the Pregel paper. A pdf of this paper can be found here.

Data points for the Giraph framework were gathered from a recent talk given by Avery Ching, slides from which can be found here .

Data points for GoldenOrb were obtained directly.

The setup and execution of GoldenOrb scalability tests were conducted by three former Ravel developers with extensive knowledge of the GoldenOrb code base and optimal system configurations, ensuring the most optimal settings were used for scalability testing.

For the results and data points presented here for all Single Source Shortest Path (SSSP) tests, binary tree graph data was used in order to allow direct comparison with published Pregel and Giraph results. (Fixed average low order outdegree data was also examined yielding weak and strong scaling numbers for GoldenOrb which are nearly identical to the results presented below for binary tree data, but results from these tests have not be included below since data points from low order outdegree graphs would not be as useful for direct comparison with published results found elsewhere).

Data for the Giraph scalability results came from a slightly more involved algorithm than single source shortest path, but has the same order of algorithmic complexity and all tests utilized binary tree graph data, hence the results can be compared in a meaningful way.

Data for the Pregel scalability results came from a single source shortest path computation run on binary tree graph data, hence the results can be meaningfully compared.


Results


MAX CAPACITY:

Pregel (at least): 166,666,667 vertices per node.

Giraph (at least): 1,666,667 vertices per worker.

GoldenOrb: ~ 100,000 vertices per node, 33,333 vertices per worker.


STRONG SCALING (SSSP):
Note: Optimal parallelization corresponds to the minimum value -1.0. Deviation from the minimum possible value of -1.0 corresponds to non-optimal parallelization.

Pregel: -0.924 (1 billion total vertices)

Giraph: -0.934 (250 Million total vertices)

GoldenOrb: -0.031 Average, -0.631 Best (100000 total vertices), 0.020 Worst (1000 total vertices)


WEAK SCALING (SSSP):
Note: Optimal weak scalability corresponds to the minimum value 0.0. Deviation from the optimal value of 0.0, corresponds to non-optimal usage of computational resources as managed by the framework.

Pregel: No Data Available

Giraph: 0.01 (1,666,667 vertices per worker)

GoldenOrb: 0.37 Average, 0.23 Best (500 vertices per node), 0.48 Worst (12500 vertices per node)


STRONG SCALING (MV):
Note Optimal parallelization corresponds to the minimum value -1.0.

Pregel: No Data Available

Giraph: No Data Available

GoldenOrb: -0.142 Average, -0.710 Best (250000 total vertices), 0.303 Worst (1000 total vertices)


WEAK SCALING (MV):

Weak scaling was not calculated due to GoldenOrb's current limited range of graph sizes and cluster configurations.


GoldenOrb Scalability Results

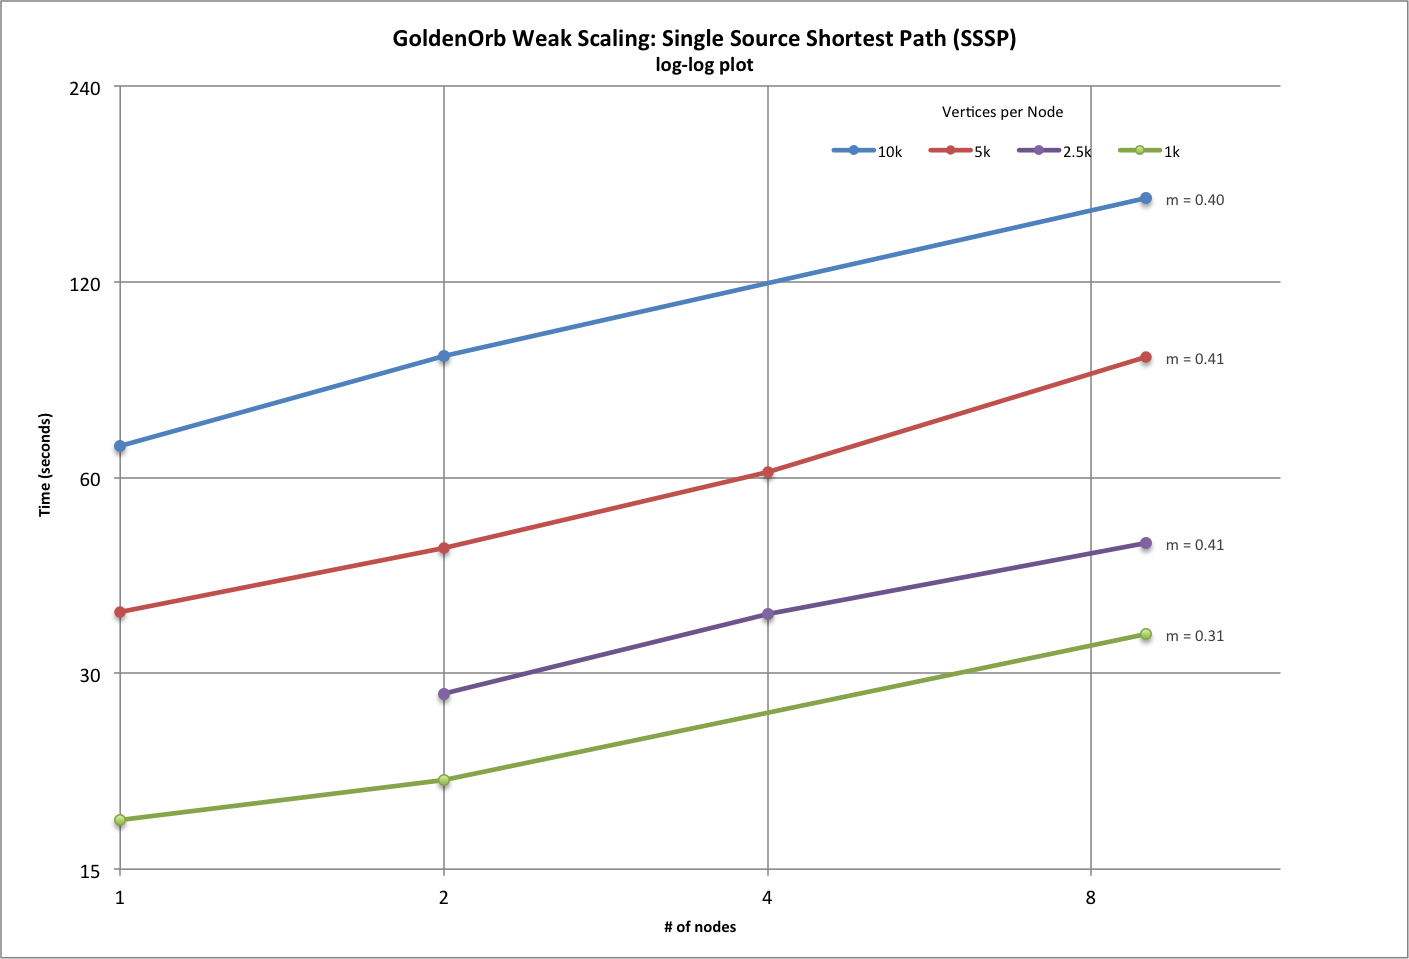
Weak Scaling Results (SSSP)
# vertices per node 250 500 1000 2500 5000 10000 12500 25000 50000
power (0.0 optimal) 0.408245144 0.231128758 0.307090584 0.353851806 0.410556488 0.395686489 0.479227847 0.323467824 0.385464748
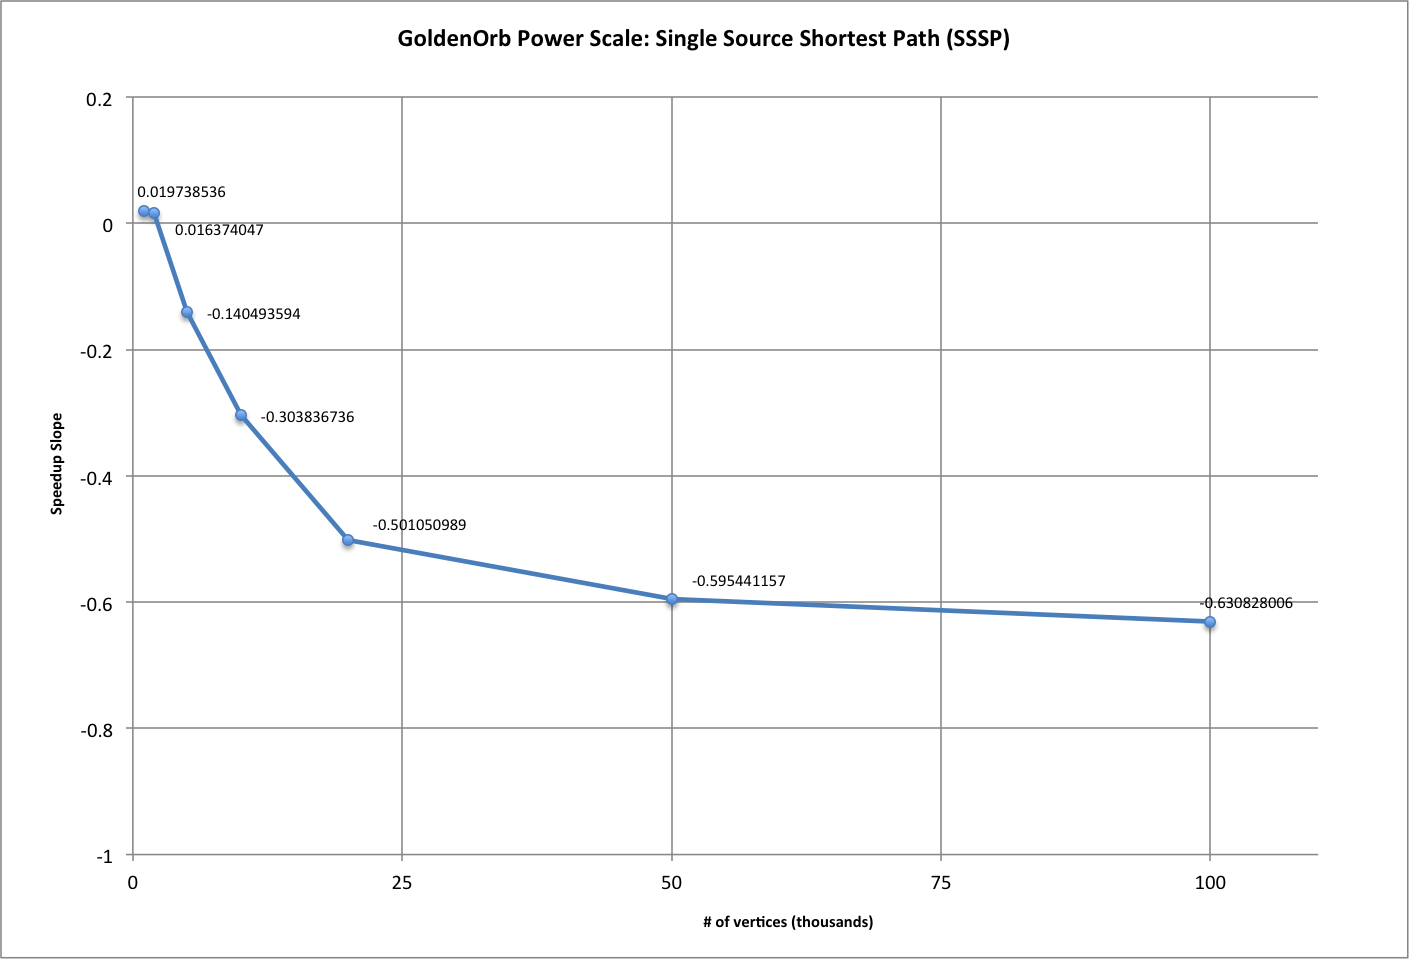
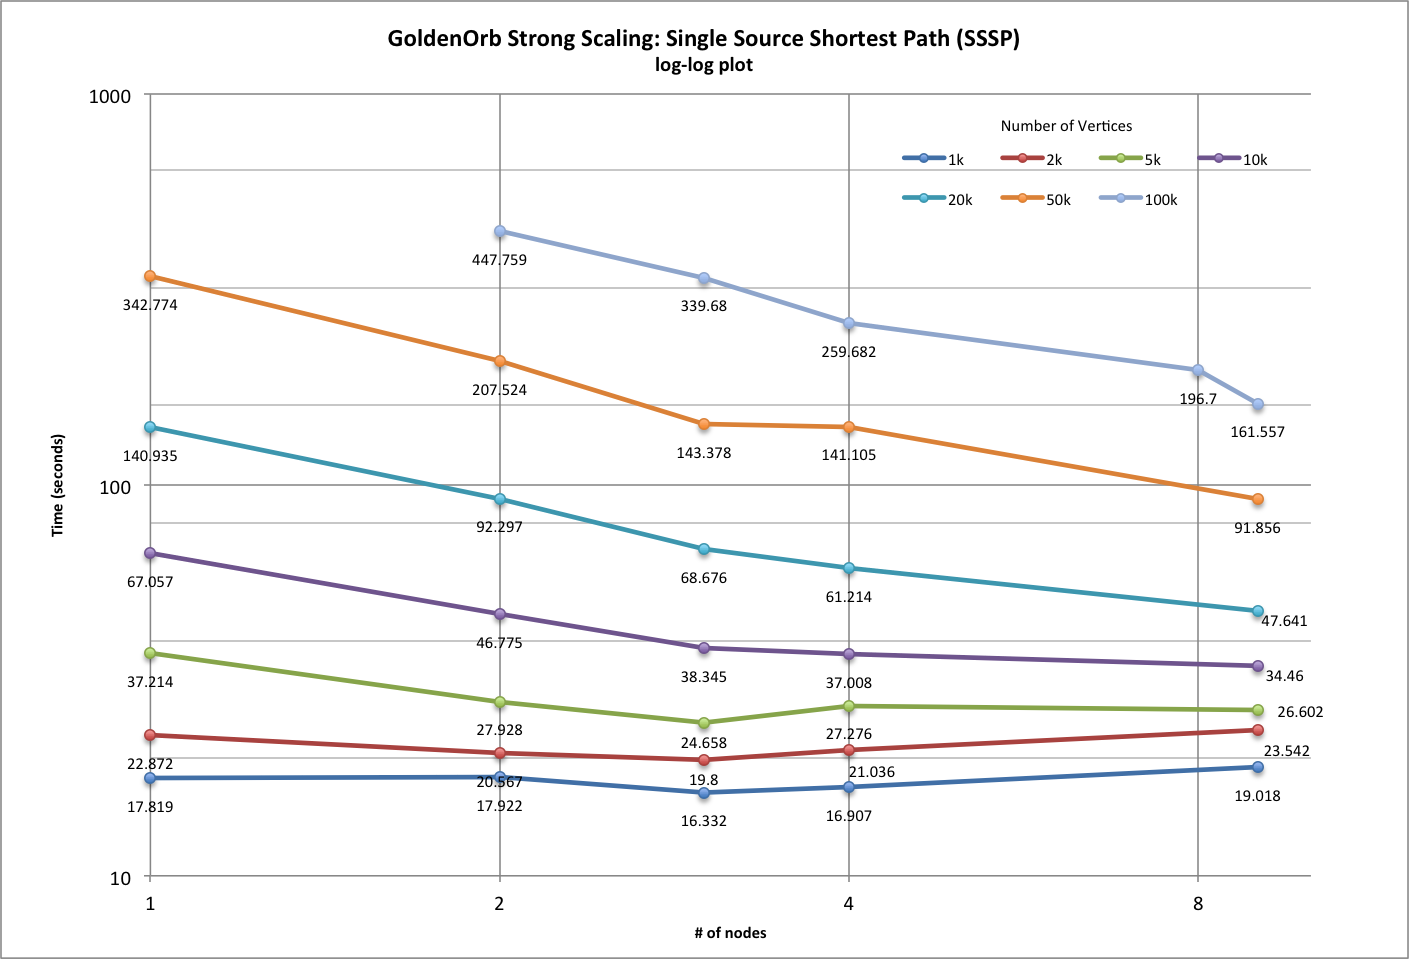
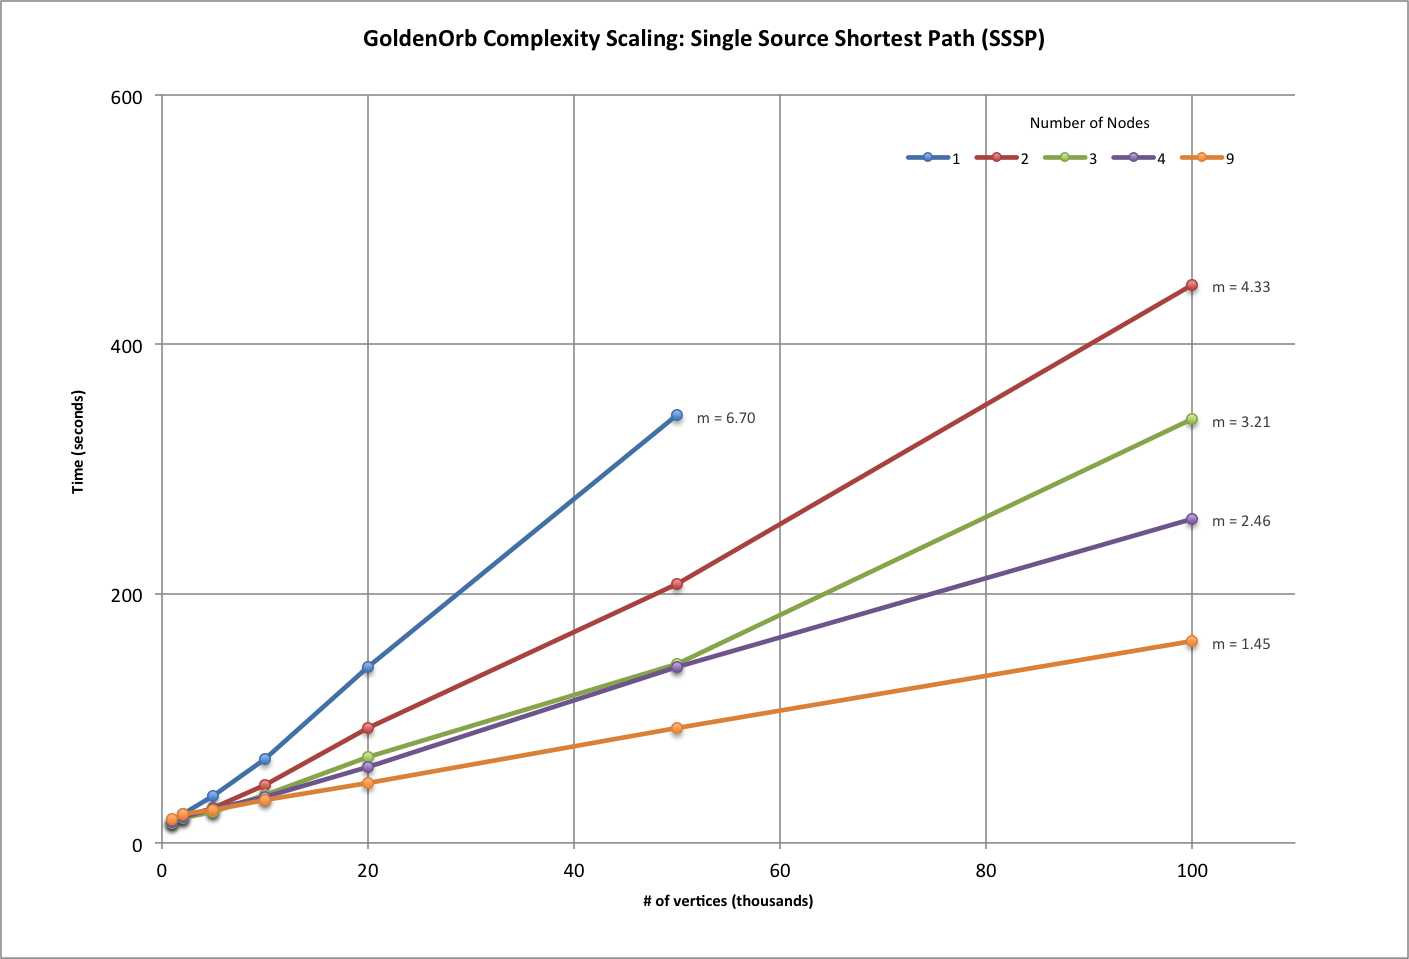
Strong Scaling Results (SSSP)
# vertices per cluster 1000 2000 5000 10000 20000 50000 100000
power (-1.0 optimal) 0.019738536 0.016374047 -0.140493594 -0.303836736 -0.501050989 -0.595441157 -0.630828006
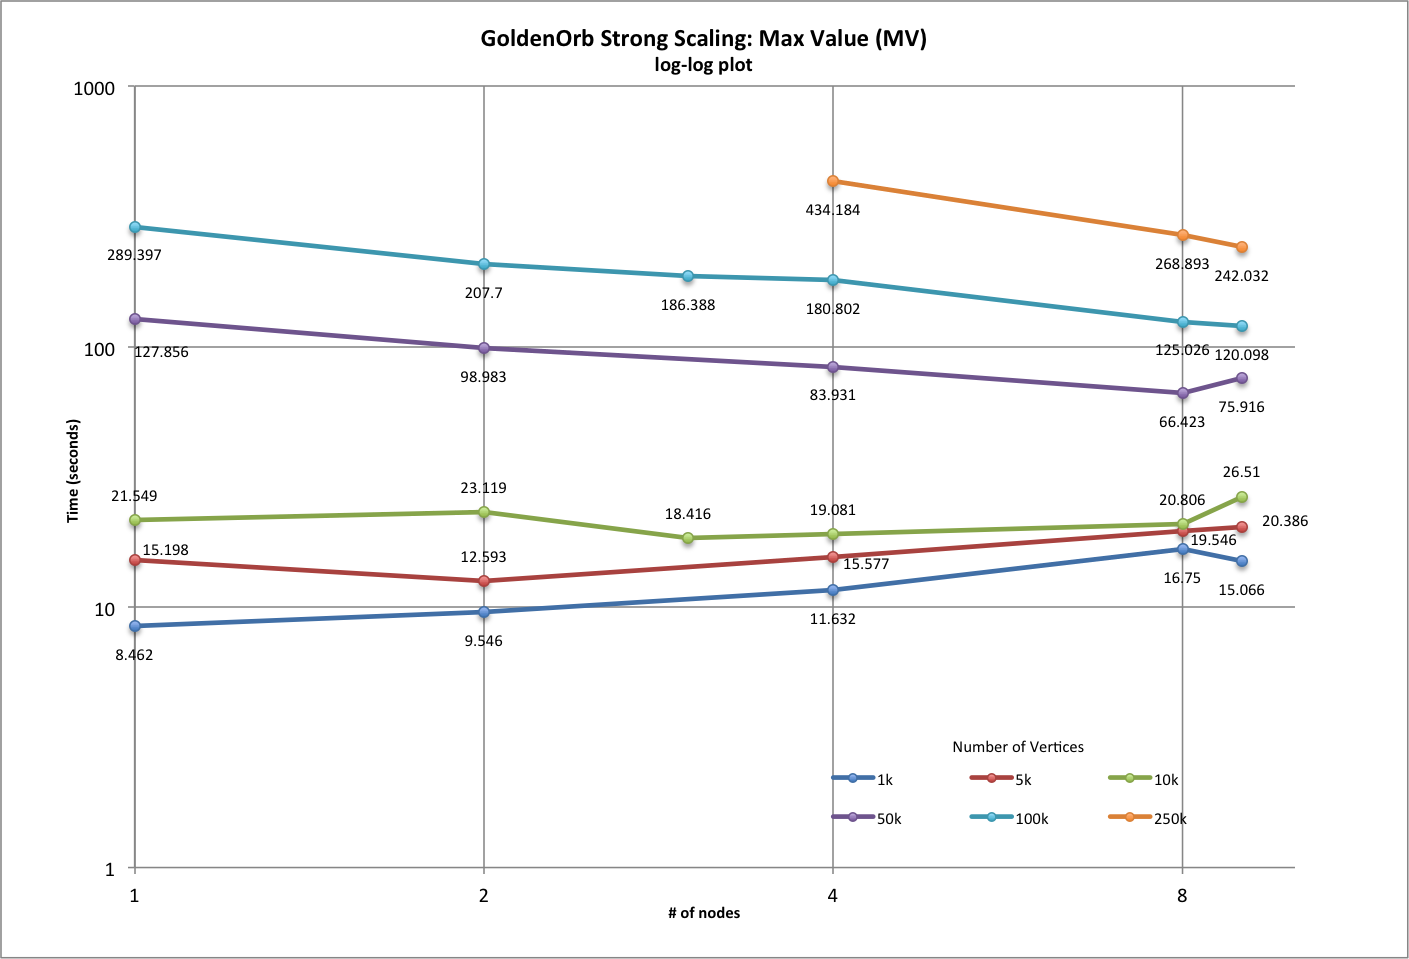
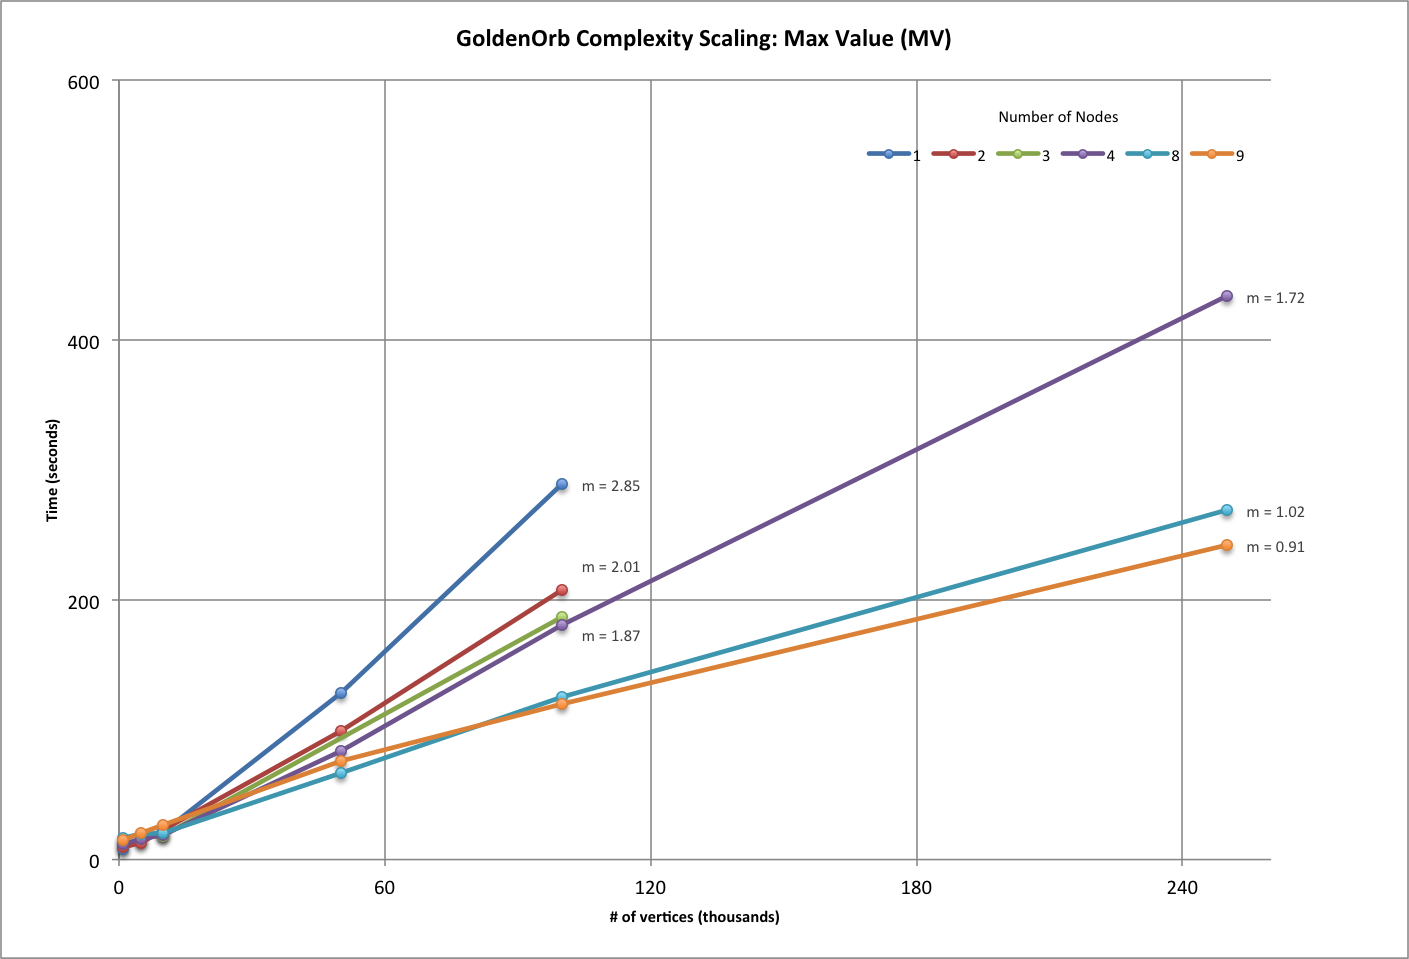
Strong Scaling Results (MV)
# vertices per cluster 1000 5000 10000 50000 100000 250000
power (-1.0 optimal) 0.303088931 0.168915436 0.038561803 -0.262642144 -0.389931207 -0.710481122


Analyzing the calculated power law speedup slopes for all single source shortest path reveals that the slope will be asymptotically bounded close to the value -0.7, meaning that GoldenOrb can do no better than about -0.7 even if the capacity issue were aleviated and larger graph sizes could be processed. This is do to the fact that the decrease in the calculated slopes drops off more quickly in relation to an increase in the number of vertices that would be permitted by a power law, hence the value will be bounded.

Due to GoldenOrb's current capacity limitations, it was not possible to gather results for larger data sets, hence insufficient values exist to draw similar conclusion for the max value problem. That being said, the max value problem is far simpler in both overhead and computation than the single source shortest path problem, so it is reasonable to expect that GoldenOrb may do slightly better than an asymptotically bounded value of around -0.7 for the slope should it become possible to run tests with larger graphs in order to determine where the asymtotic bounded value falls.

A plot of the power law coefficients calculated for the single source shortest path runs showing the bounded speedup coefficient data is provided below.


Plots

Below are plots of results from all configurations for single source shortest path (SSSP) and max value (MV). Strong and weak scaling are detailed in the links provided above. Complexity graphs are provided to show that the execution time for each algorithm scales linearly, justifying the use of fixed vertices per node to calculate weak scaling properties.

Note: All strong and weak scaling results are log-log plots, which is appropriate for data related by a power law. Complexity results are plotted using standard, unscaled, axis.


SINGLE SOURCE SHORTEST PATH (SSSP):


MAX VALUE (MV):


HOME