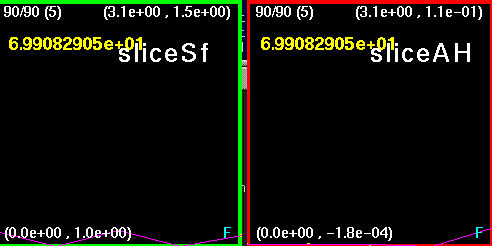
 These
two pictures depict (from right to left)
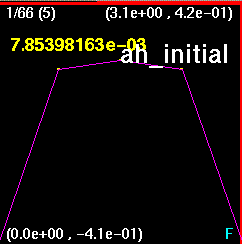
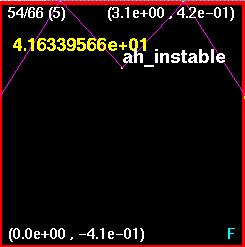
The three snapshots above depict the evolution of the curvature of the
black hole spacetime with theta. The first picture, ah_initial,
is the starting step. ah_instable shows a later evolution step during
at which an instability is evident.
The last step (6546 iterations) is shown in ah_end.
Note that the grid spacing was 5, an exceedingly coarse resolution
and the the courant factor was 0.01
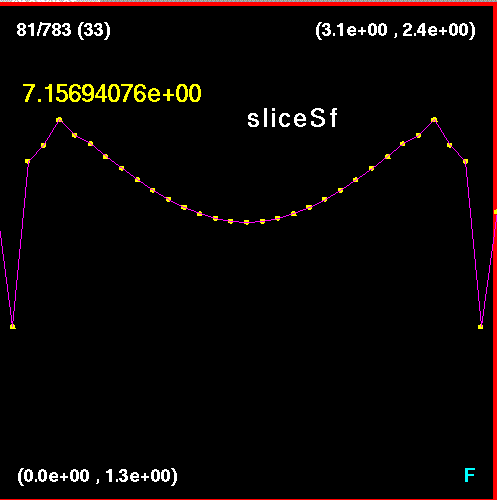
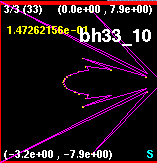
 This picture
is the value of the curvature (kappa) at every point at the first iteration
step plotted versus theta.
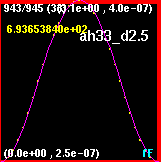
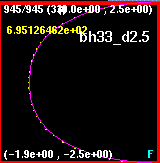
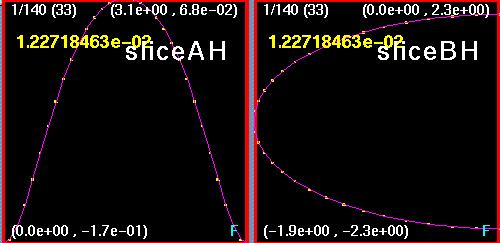
The pictures below depict, left, kappa versus theta at the last time
step with average value near 10^-10;
and right, x versus y at this slice of phiat the last time step.
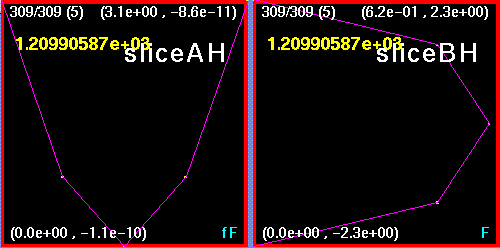
Note that only one apparent horizon is indicated in sliceBH; therefore,
at this
coarse grid the algorithm has been unable to find two apparent horizons.
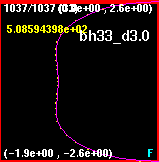
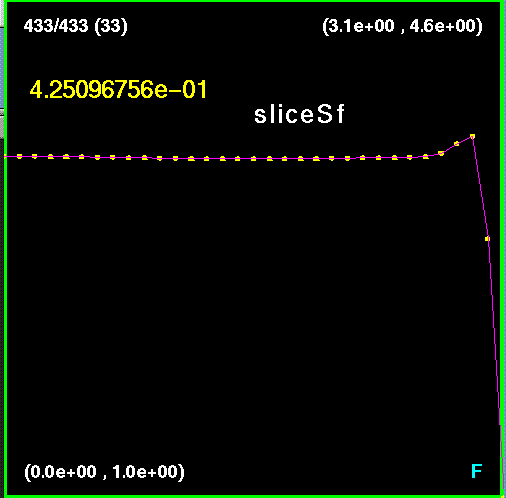
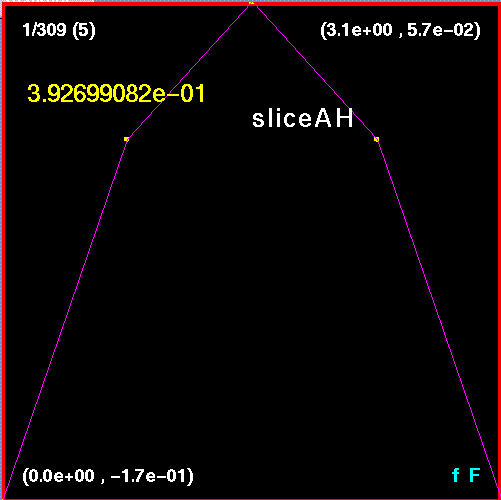
 This image
is a slice along the symmetry axis at the last step. It shows that
no indication of two apparent horizons yet exists at kappa=10^-8.
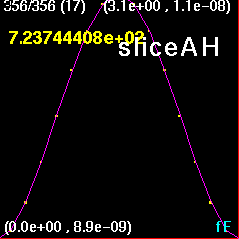 This image plots
kappa versus theta at the last time step.
The shape indicates that kappa is not constant over the surface,
however the discrepancy is small.
The picture below looks at this discrepancy. This is a plot of
the infinity norm of the difference
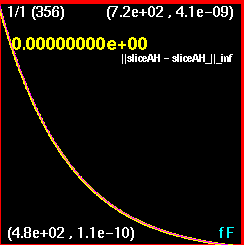
of two steps. You can see that the change between steps is decreasing.
