| Level | Time |
Area
|
| 1 | 0.00 | 113.01403689812673 |
| 2 | 12.5 | 110.82643196290003 |
| 3 | 25.0 | 109.76607257911137 |
| 4 | 37.5 | 109.84143989070462 |
| 5 | 50.0 | 113.31567896961667 |
| 6 | 62.5 | 116.36199852655126 |
| 7 | 75.0 | 117.08274703682969 |
| 8 | 87.5 | 115.83818059217722 |
| 9 | 100.0 | 113.7541756136812 |
| 10 | 112.5 | 111.99486632303379 |
| 11 | 237.5 | 111.41140407355647 |
| 12 | 250.0 | 112.77285180817867 |
| 13 | 262.5 | 114.7050735788803 |
| 14 | 275.0 | 115.71703897458197 |
| 15 | 287.5 | 115.41580845398124 |
| 16 | 300.0 | 114.28838979543096 |
| 17 | 400.0 | 113.10525550581096 |
| 18 | 412.5 | 112.588882158296 |
| 19 | 425.0 | 113.01652444784278 |
| 20 | 437.,5 | 113.97653830704616 |
| 21 | 450.0 | 114.72295264947419 |
| 22 | 462.5 | 114.81314624479283 |
| 23 | 475.0 | 114.32830421063878 |
| 24 | 487.5 | 113.66718527496359 |
| 25 | 500.0 | 113.26359034067842 |
| 26 | 512.5 | 113.33403816573446 |
| 27 | 525.0 | 113.76344695230138 |
| 28 | 537.5 | 114.216447369612 |
| 29 | 550.0 | 114.401580176358 |
| 30 | 114.24210952208975 | |
| 31 | 113.8927436522826 | |
| 32 | 113.61380650209742 | |
| 33 | 113.57507548715517 | |
| 34 | 113.76661629081877 | |
| 35 | 114.00296741630068 | |
| 36 | 114.14545272544302 | |
| 37 | 114.14065728244438 | |
| 38 | 114.01752414479448 | |
| 39 | 113.85045996099362 | |
| 40 | 113.76012274011306 | |
| 41 | 113.8524081349813 | |
| 42 | 114.05621461001887 | |
| 43 | 114.25397337667215 | |
| 44 | 537.5 | 114.32196087111545 |
| 45 | 550.0 | 114.52594386386208 |
| 46 | 562.5 | 114.73258192226156 |
| 47 | 575.0 | 115.28818364352389 |
| 48 | 587.5 | 115.67851697895206 |
| 49 | 600.0 | 116.85018281293711 |
| 50 | 612.5 | 117.83087921586515 |
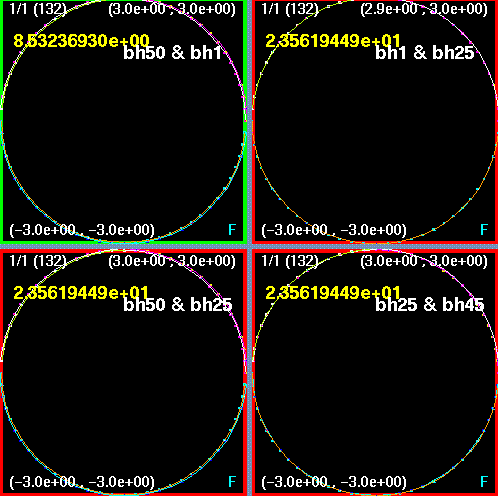
bh1&bh25 - the two surfaces visually coincide
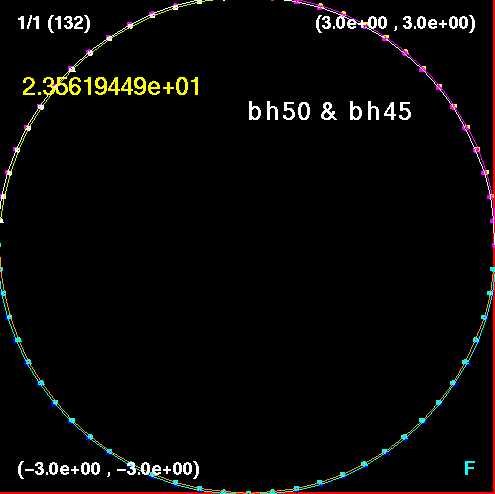
bh25&bh45 - the two surfaces visually coincide