Results of Breakage Testing in MCF
Images correspond to the links in the table on page :
http://wwwrel.ph.utexas.edu/Members/deirdre/research/mcfbreaking.html
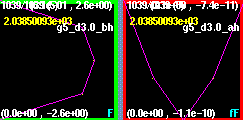
There are 3 grid sizes represented below, 5, 17, and 33. For each
grid size, the sparations 3.0, 3.1, and 3.2 have two plots one of curvature
versus theta and one of y versus z of the surface. Both plots are
slices of the 3-d space into 2-d along a common phi, utilizing the cylindrical
symmetry of the 2 black hole spaceime. All plots are snapshots
of the data, usually at the last time step.
Grid Size: 5 (Coarse)
Separation: 3.0
Separation 3.1 is not displayed at this grid size since the resolution
is too poor for any indentation in the center to occur.
Separation: 3.2
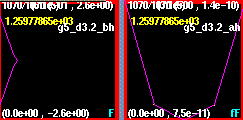 This is beyond the critical separtion, therefore, no single apparent horizon
exists to envelope both masses in this system. The plot to the left
is the y versus z surface plot showing the instability that arises when
there is not a single minimal surface.
Grid Size: 17 (medium)
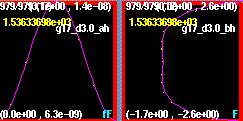
Separation: 3.0
Separation: 3.1
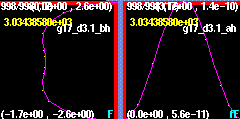 We
see the expected "peanut" like indention in the shape. This separation
should be near the critical separation beyond which there is no longer
a single horizon.
Separation: 3.2
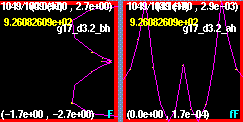 The
critical separation is surpassed and the code contains instabilities as
two surfaces are not necessary to obtain zero curvature as expected on
the apparent horizons. The instability grows starting from the center
of the two masses.
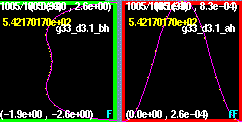
Grid Size: 33 (Fine)
Separation: 3.0
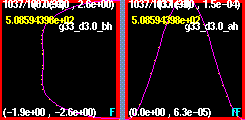
Separation: 3.1
Separation: 3.2
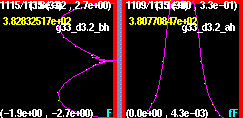 Once again the critical separation is surpassed and the instability begins
at the center of the two masses. The plot to the right is a snapshot
of the curvature. Spikes are beginning to grow at this time during
the evolution but are obscured by the numbers at the top of the image.
Please look below for further investigations of the curvature instability.
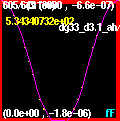
Separation: 3.1
Plot of the time derivative of the curvature of the surface at a separation
of 3.1, where no instabilities appeared in the plot of the surface (above).
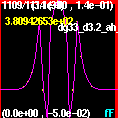
Separation: 3.2
Plot of the time derivative of the curvature of the surface at a separation
of 3.2 where instabilities did appear in the plot of the surface
(above).
The plot below is the L-infinity norm is taken of the difference
between two time levels in the curvature.
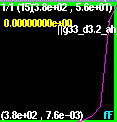 Note the increase
late in the evolution corresponding to the growing instabilities depicted
above.


 This is beyond the critical separtion, therefore, no single apparent horizon
exists to envelope both masses in this system. The plot to the left
is the y versus z surface plot showing the instability that arises when
there is not a single minimal surface.
 We
see the expected "peanut" like indention in the shape. This separation
should be near the critical separation beyond which there is no longer
a single horizon.
 The
critical separation is surpassed and the code contains instabilities as
two surfaces are not necessary to obtain zero curvature as expected on
the apparent horizons. The instability grows starting from the center
of the two masses.

 Once again the critical separation is surpassed and the instability begins
at the center of the two masses. The plot to the right is a snapshot
of the curvature. Spikes are beginning to grow at this time during
the evolution but are obscured by the numbers at the top of the image.
Please look below for further investigations of the curvature instability.

 Note the increase
late in the evolution corresponding to the growing instabilities depicted
above.